Visual Analytics in Industrial Software Maintenance
Apr 22nd, 2010 | By Prof. Dr. Alexandru C. Telea | Category: Featured Articles, NewsSoftware maintenance is the most expensive part of the entire software lifecycle. Studies over 20 years in a variety of branches of the software industry indicate that maintenance costs over 80% of the effort invested in the entire lifecycle of a software product. From this, around 40% is dedicated to software understanding.
We have worked over several years in close contact with IT professionals in various branches: software developers, architects, consultants, and producers of software analysis tools. During several studies, we have observed that software understanding in maintenance follows a visual analytics pattern. Key elements here are the tight integration of data extraction (data mining), data analysis, and interactive visualization. Interestingly, this visual analytics perspective is relatively new and unknown in the software industry, where data mining, analysis, and visualization are still relatively separate topics.
As an example of our findings, here are two sample projects.
Visual Analysis of Build Processes
In this project, we helped a major embedded software producer optimize the build times of their 17.5 million lines C code base, developed by over 600 programmers worldwide. The solution involved using static analysis to extract dependencies between files and symbols from the entire code base, defining and validating a build cost model based on these dependencies, and designing a simple visualization to show the cost of touching a source file and suggesting ways for architects to automatically refactor the code to reduce build times. Details are described in this paper.
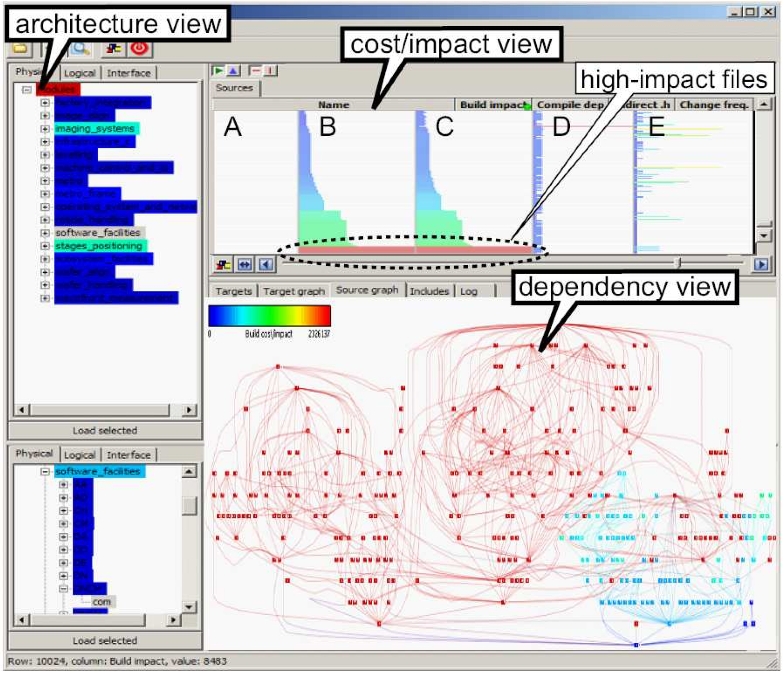
Visual analysis of software build process optimization
Product and Process Assessment
In this project, we examined the use of visual analytics in helping consultants performing product and process assessments. Consultants have specific requirements: They work under intense pressure and for short timespans, and must deliver their results in a clear, simple way to a mixed group of technical and business audiences. We tested the usage of a wide set of analysis and visualization techniques and discovered several interesting points, such as the added value of mixed visual representations, and involving the stakeholders in interpreting the findings as opposed to letting the experts explain the images. Details are described in this paper.
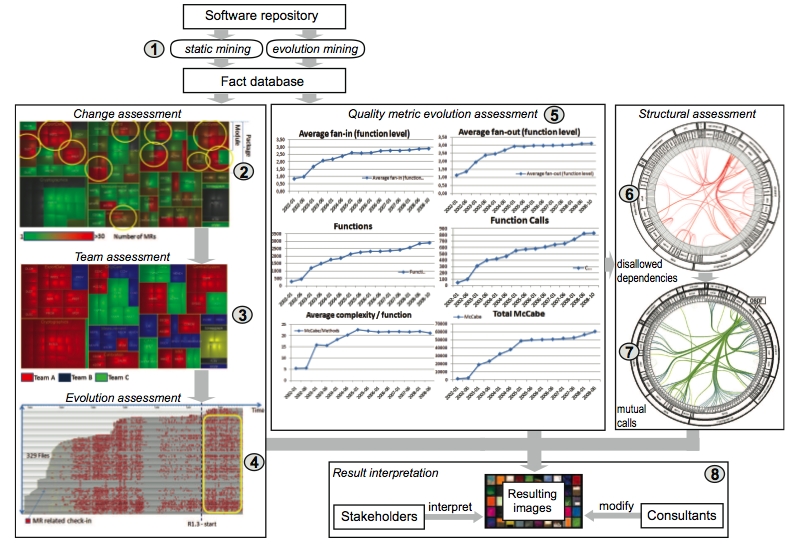
Visual analytics pipeline in software product and process assessment
Lessons Learnt
Visual analytics proves to be an excellent way to structure and explain the understanding activities in software maintenance, especially when software visualization tools are involved in the process. We have seen strong evidence that visual analytics tools, methods, and approaches are highly efficient and effective in tackling the challenges of software maintenance in various types of activities in the software industry.
However, together with this observation, we also have seen several challenges to the adoption of visual analytics (and software visualization in particular) in the IT industry. Technical challenges include the tight integration of simple, suggestive, visual metaphors and automated analysis tools in the same systems. Conceptual challenges include the design of analysis and visualization tools, techniques, and presentation layers in ways that directly reflect the so-called value drivers of this industry.
In this sense, we foresee a strong growth of visual analytics in the IT industry if the tools and methods proposed are reformulated to make explicit the value and waste factors involved, and thus make more clear the benefits and costs they propose to stakeholders in this field. For details, we refer to this paper.
Acknowledgements
This work was done in cooperation between the University of Groningen (the Netherlands), SolidSource BV (the Netherlands), and SE-CURE AG (Switzerland).