SLIVISU – A visual analytics tool to validate simulation models against collected data.
Dec 14th, 2009 | By VisMaster Team | Category: Featured Articles, NewsEnvironmental simulation models are created to understand environmental processes and to analyse future scenarios. To asses the quality of simulation models various methods are applied, one is to validate model output against collected data. In the case of large-scale or global simulation models, there is often a lack of adequate validation data. Additional a scale and conceptional mismatch exists: The collected data is mostly available only at single points and it is often of different quality in terms of accuracy. Modelled data in contrast is calculated on a continuous grid. In spite of these restrictions a scientist has to face the challenge to create knowledge about how the model fits with the collected data and how the model‘s quality varies in space and time.

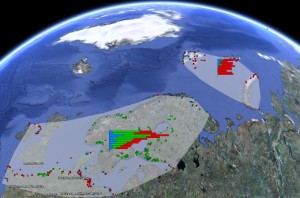
Representation of spatial distribution of single SLIs as well as summarized values of quantity (bar lenght), quality type (colour) and age (position at the vertical diagram axis) of all SLIs in a cluster.
In our case we have collected data from sea level indicators (SLIs) which give information about former sea level, and modelled data form glacial isostatic adjustment simulation models to predict sea level change. The sea level indicators are described by their location (x,y,z-coordinates), age and quality. About 14.000 SLIs are available for the last 60 000 years and are irregularly distributed in the northern hemisphere. The modelled data are calculated for a regular square grid.
Summary
In order to support the scientists in gaining insight into the data and the consistency between data and model, a visual analytics concept and prototype was developed to fulfil following tasks:
Making apparent
- the distribution of collected data over space and time in order to see the distribution pattern
- the various quality measures of the collected data in order to determine their usefulness for model assessment
- the difference of calculated and modelled data in space and time in order to receive some information where the model has to be improved.
A combination of methods from analysis and visualization is applied in the concept to support the tasks:
- The Sea Level Indicator (SLI) data are clustered according to the collection process or data availability; the cluster is presented by an adaptive convex bounding box.
- All information about the SLIs in a cluster is summarized in a multivariate summation diagram which depicts the number of SLIs of a certain quality in various time intervals (see attached image).
- Information about single SLIs can be presented interactively on demand
- The difference between values from SLI data and the output data from the model is calculated and presented for a cluster in a composed multivariate summation diagram that shows the amount of SLIs of a certain quality and time interval which fit and which do not fit with the model data. The calculation of data consistency is realized in two different modes: either via defined ranges of values or via a fuzzy logic approach.
The visual analytics concept has been implemented in the tool SLIVISU with Java, KML, SVG, Google Earth, and PostgreSQL. It has been developed in close cooperation between the Earth Scientists and the GeoVisalization Group of German Research Centre for Geosciences, GFZ, and the University of Applied Science Anhalt Although the tool is directed to a specific application field, general problems, challenges and solutions can be filtered out as mentioned already at the beginning and be transferred and adapted to similar challenges and applications.
Contact
Prof. Dr. Doris Dransch, German Research Centre for Geosciences
Dr. Volker Klemann, German Research Centre for Geosciences
Sven Schulte, University of Applied Science Anhalt